Forecast Accuracy vs Bias: Key Differences
Difference between inventory and stock — Understand forecast bias vs accuracy in demand planning. Learn how to fix forecasting errors and reduce stockou...
Hylke Reitsma is co-founder of Forthsuite and a supply chain specialist with 8+ years of hands-on experience at Shell, Verisure, and Stryker. He holds an MSc in Supply Chain Management from the University of Groningen and writes practical guides to help e-commerce teams run leaner, faster supply chains. Selected by Replit as 1 of 20 founders for the inaugural Race to Revenue Cohort #1 (2026) and certified as a Replit Platform Builder.
Bias and Accuracy in Demand Forecasting
Quick answer: Bias and accuracy describe two different ways a demand forecast can go wrong. Accuracy is how far predictions sit from actual demand in either direction; bias is a consistent lean — always forecasting a bit high or a bit low. Tracking both tells you not just how wrong a forecast is, but in which direction it keeps erring.
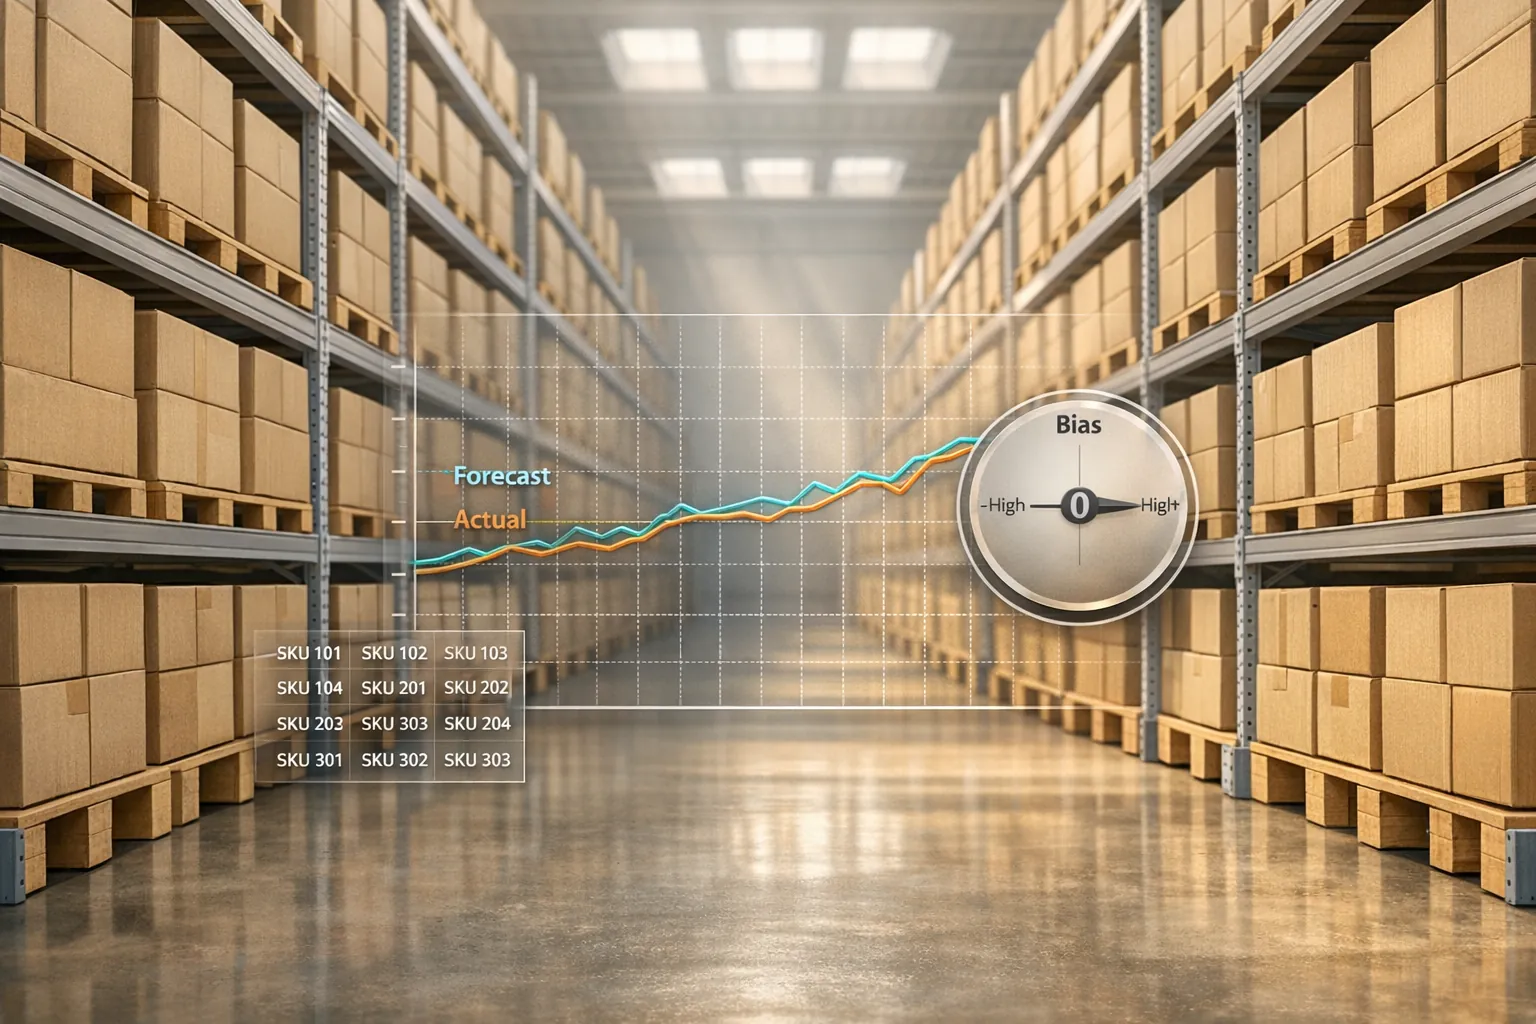
TL;DR: Accuracy tells you how close your forecasts are; bias tells you whether they systematically over- or under-shoot — and inventory pays for both. Forthcast reports per-SKU accuracy and bias for Shopify operators, so you can spot and correct a forecast that consistently leans.
Quick answer: Bias and accuracy describe two different ways a demand forecast can go wrong.
- Accuracy is closeness to actual demand; bias is a consistent directional error
- A low-bias but inaccurate forecast still misses; a biased one errs the same way every cycle
- Untracked bias compounds into chronic overstock or recurring stockouts
- Measuring both per SKU shows how wrong a forecast is and which way it leans
Struggling with demand forecasting? The stakes are high: $1.77 trillion is lost annually due to inventory issues like stockouts and overstocking.
Forecast accuracy and bias are two critical factors that determine whether businesses thrive or face financial strain. While accuracy measures how close forecasts are to actual demand, bias reveals consistent over- or under-estimations that can wreak havoc on inventory and operations.
Key Takeaways:
- Forecast Bias: Systematic over- or under-forecasting leads to costly stock issues. Example: Over-forecasting ties up capital, while under-forecasting results in stockouts and lost sales.
- Business Impact: A small error, like 2% bias, can disrupt inventory across locations. Fixing bias can cut inventory costs by 20–30%.
- Causes of Bias: Human judgment errors, poor data quality, and demand variability are common culprits.
- Solutions: Regularly measure bias at granular levels (e.g., SKU-location), clean historical data, and limit manual overrides.
Balancing bias and accuracy is essential for better inventory decisions and financial performance. Tools like Forthcast leverage AI to address these challenges, offering smarter forecasting and measurable cost savings.
What is Forecast Bias and Why It Matters
Defining Forecast Bias
Forecast bias occurs when predictions consistently lean in one direction - either higher or lower than the actual demand. This isn’t the same as random error; it’s a systematic deviation. Positive bias means over-forecasting (predicting more demand than actually occurs), while negative bias means under-forecasting (predicting less demand than realized).
“I feel like people over complicate them [inventory tools]. It's like, how much inventory do I have today? Or if it's a bundle, like, how much could I have of this bundle based on my inventory today? And then it's like, all right, what's my forecast? When am I gonna run out? Like, some people just have like, oh, it's at these. This one, it was. It was like, so advanced. Or they were trying so hard to be so advanced. It was like, this is your, like, expected day... no, here's my forecast. Here's what I need. Like, what am I gonna run out? Like, is more what I want to know.”
“Still manual pulls from 10+ places (e.g., Google Sheets) for full sync.”
To measure bias, a common formula is used: (Forecast / Actual) × 100. A result over 100% indicates over-forecasting, while anything below 100% signals under-forecasting.
One challenge with forecast bias is that averaging errors can hide these patterns. For instance, over-forecasting some items while under-forecasting others might appear balanced overall, but the underlying issues remain. In consumer goods, the average forecast bias can reach 35%, a substantial figure that impacts inventory management and operational efficiency. These deviations don’t just affect numbers - they directly influence costs and customer satisfaction.
Business Impact of Forecast Bias
Forecast bias isn’t just a statistical quirk - it has real-world consequences for businesses. Its financial and operational effects can disrupt demand forecasting and decision-making. Take Hewlett-Packard’s 2002 case study, for example. By identifying and eliminating systematic bias in one product line, they managed to cut inventory levels by 20% to 30% without sacrificing product availability.
"Eliminating bias from forecasts resulted in a twenty to thirty percent reduction in inventory." - Kakouros, Kuettner, and Cargille, HP Case Study
Even a small bias, like 2%, can have a massive impact when scaled across multiple locations, tying up significant capital. In fresh food retail, over-forecasting by just 10% can wipe out a category’s profit due to spoilage and waste.
Here’s how different types of bias affect businesses:
| Bias Type | Inventory Impact | Financial Consequences | Operational Risks |
|---|---|---|---|
| Positive Bias (Over-forecasting) | Excess stock, overcrowded warehouses | Locked-up capital, higher carrying costs | Increased waste and product obsolescence |
| Negative Bias (Under-forecasting) | Stockouts, empty shelves | Lost sales, higher emergency shipping costs | Customer dissatisfaction, staffing shortages |
The effects of forecast bias extend beyond retail. For instance, the UK Department of Transportation now mandates cost uplifts - 40% for rail projects and 10% to 200% for IT projects - based on historical trends of underestimating costs and timelines. These adjustments aim to counteract "optimism bias", ensuring more realistic budget forecasts. By addressing these patterns, organizations can better manage resources and expectations.
Forecast accuracy and Forecast Bias%, what is the difference?
“Issues with stock across warehouses affecting availability.”
Bias vs. Accuracy: Understanding the Difference

Forecast Bias vs Accuracy: Key Differences and Business Impact
Measuring Forecast Accuracy
Forecast accuracy measures how closely predictions match actual demand. It’s quantified using metrics like MAPE (Mean Absolute Percentage Error), which averages percentage errors across forecasts; MAD (Mean Absolute Deviation), which calculates error in units; and WAPE (Weighted Absolute Percentage Error), which adjusts for sales volume to provide a more realistic view of performance.
Accuracy is a key indicator of forecast reliability. When accuracy is high, businesses can maintain leaner inventory levels and smaller safety stocks. On the other hand, low accuracy forces companies to increase buffers to handle demand unpredictability. For instance, high-volume, stable items typically achieve accuracy rates of 85–95%, while slow-moving, erratic products tend to hover around 50–70%.
These metrics provide a foundation for understanding forecast performance, but relying on just one can create blind spots in inventory planning.
Why Both Metrics Matter
A forecast can seem accurate overall while hiding significant bias issues. This happens when over-forecasting for some products balances out under-forecasting for others, creating what’s known as the "illusion of accuracy". While the total numbers may appear correct, individual SKUs could still suffer from persistent stockouts or overstock situations.
"High accuracy does not mean there is no bias. A forecast can be consistently wrong in the same direction." - RELEX Solutions
Accuracy reflects the magnitude of random errors, while bias uncovers systematic trends in one direction - such as consistently overestimating or underestimating demand. For example, low accuracy paired with zero bias points to random errors, requiring larger buffers. In contrast, high accuracy with noticeable bias signals deeper structural issues, like excess inventory tying up capital or frequent stockouts affecting sales.
| Metric | What It Measures | Business Impact of Neglect |
|---|---|---|
| Forecast Accuracy | Magnitude of deviation (e.g., MAPE, RMSE) | Insufficient safety stock, poor labor planning, and inefficient buffer management |
| Forecast Bias | Directional tendency (e.g., over- vs. under-forecasting) | Inventory imbalances, tied-up capital (positive bias), or recurring stockouts (negative bias) |
Tracking both metrics at the SKU-location level is essential. Focusing only on aggregate data can obscure product-specific challenges, which ultimately disrupt operations and profitability. By balancing accuracy and bias, businesses can fine-tune their forecasting processes and avoid costly mistakes.
What Causes Bias in Demand Forecasting
Human Judgment Errors
Human judgment often skews demand forecasts. For instance, optimism bias can lead forecasters to overestimate demand, favoring positive outcomes over realistic projections. Sales teams can make this worse through incentive-driven bias, where forecasts are inflated to meet aggressive targets or ensure stock availability. In the consumer goods sector, this issue is so prevalent that forecast bias averages around 35%.
Another common problem arises when forecasters respond to irrelevant data, making unnecessary adjustments that harm accuracy. Studies reveal that in some companies, demand planners modify up to 80% of statistical forecasts. Interestingly, small adjustments tend to harm accuracy more than they help, while larger changes, often tied to significant known events, are typically more effective.
"Positive adjustments, which involved adjusting the forecast upwards, were much less likely to improve accuracy than negative adjustments." - Robert Fildes, Professor of Management Science, Lancaster University
These judgment errors create ripple effects, complicating data integrity and increasing demand variability.
Data Quality Problems
Data quality issues can severely distort forecasts. One major culprit is stockout distortions. When businesses fail to exclude stockout periods from historical data, they end up underestimating actual sales, leading to overly optimistic future forecasts. Similarly, ignoring cannibalization - where one product’s sales reduce another’s - or customer substitutions results in skewed predictions for both products.
Manual forecasting also introduces subjectivity. Sales teams often inflate forecasts to meet targets or ensure adequate stock. Additionally, failing to account for external factors like weather, holidays, or promotions can cause systems to misinterpret event-driven spikes as baseline demand. A striking 90% of surveyed professionals identified pricing as one of the most critical variables affecting forecast accuracy.
Relying too heavily on outdated trends compounds the problem. Historical data that doesn’t reflect recent market shifts leads to bias, as models struggle to adapt to evolving consumer behaviors. Without automated tools to detect patterns across thousands of SKUs, businesses may overlook subtle but important trends like seasonality.
Demand Variability and Forecast Timeframes
Demand patterns and forecasting horizons also play a role in creating bias. Intermittent demand, characterized by sporadic and low sales volumes, makes it harder to identify and correct errors. Interestingly, even the most "accurate" forecasts don’t always align with cost-effective inventory management, highlighting a disconnect between accuracy and practical outcomes.
Longer forecasting horizons amplify bias risks. Over extended timeframes, planners often make more frequent adjustments, many of which introduce systematic bias rather than improving predictions. Optimism bias, in particular, drives upward adjustments that frequently degrade accuracy. To address this, the UK Department of Transportation applies automatic cost adjustments to initial estimates, ranging from 40% for rail projects to as much as 200% for certain IT projects, depending on complexity.
sbb-itb-499c055
How to Detect and Fix Forecast Bias
Methods for Detecting Bias
Identifying forecast bias starts with calculating the Mean Error (ME). This metric highlights whether forecasts tend to consistently overshoot or undershoot actual demand, revealing systemic issues.
To get a clearer picture, measure bias at the Store-SKU-day level. Aggregated data often hides discrepancies because over-forecasts and under-forecasts can balance each other out. By focusing on granular data, you can pinpoint where actual ordering decisions are being impacted. Even a small bias, like 2%, can disrupt inventory management when individual item-level patterns are overlooked.
Another tool is cycle error, which measures the degree to which inaccuracies affect replenishment decisions. A cycle error below 0.25 generally means that forecast errors aren’t significantly altering order quantities. However, a value above 1.0 indicates that the forecast is skewing decisions, leading to inefficiencies in inventory management.
It’s also important to monitor manual overrides. Research shows that upward adjustments tend to harm forecast accuracy more than downward ones, making it crucial to track and evaluate these changes.
Once bias is identified, the next step is implementing strategies to correct it.
Steps to Reduce Bias
Fixing forecast bias requires a methodical approach, starting with cleaning historical data. For example, remove periods of stockouts from demand history. Otherwise, forecasts may appear overly optimistic when, in reality, supply constraints were the issue. Adjust for factors like cannibalization and substitutions to ensure the baseline demand reflects actual trends.
Direct manual reviews where they matter most. Use exception-based reporting to focus on high-value, stable-demand items (often called "AX" items). For these products, set stricter thresholds to trigger reviews. Meanwhile, allow more flexibility for low-value items, where the cost of reviewing discrepancies may outweigh the benefits.
Minimize minor overrides, as these often reduce accuracy. Reserve manual adjustments for exceptional situations, such as promotions or sudden market changes. To tackle behavioral issues, apply the "Four Levers" framework:
- Use multiple perspectives (Sales, Finance, Supply Chain) to analyze forecasts.
- Encourage collaboration across teams.
- Maintain an assumption-based approach to identify biases early.
- Implement closed-loop feedback to refine processes over time.
"What makes forecast bias issues difficult to fix is that there is usually a behavioral root cause associated with them." - Carlos Madruga, Tina Starr, and Josh Stewart
Finally, align measurement timelines with actual business decisions. For example, if overseas orders require a 12-week lead time, evaluate forecast accuracy specifically at that interval. This ensures that your analysis directly supports decision-making processes.
| Detection Method | Correction Action | Result |
|---|---|---|
| Bias % > 100% | Review sales optimism and promotional assumptions | Reduced excess inventory and storage costs |
| Bias % < 100% | Check for missed market shifts or unrecorded promotions | Fewer stockouts and increased sales |
| Cycle Error > 1.0 | Re-tune models or adjust parameters for affected SKUs | Optimized order quantities and labor efficiency |
| Tracking Signal Analysis | Address behavioral causes behind overrides | Reduced systematic human errors |
Using Forthcast to Balance Bias and Accuracy

Tackling the ongoing challenges of forecast bias and accuracy, Forthcast uses AI-driven tools to address these issues head-on. By integrating proven strategies for detecting and correcting bias, Forthcast offers a powerful, data-centric solution.
AI-Powered Forecasting Methods
Forthcast approaches the bias and accuracy dilemma with a hybrid baseline model that blends statistical techniques with machine learning. This model adapts to each SKU, selecting the most effective forecasting method dynamically.
With tracking signal analysis, Forthcast pinpoints patterns of over- or under-forecasting at the SKU level. By evaluating Mean Error (ME) alongside accuracy metrics, it delivers the detailed insights needed for precise inventory decisions.
Another key feature is anomaly detection, which filters out one-off events from future demand predictions. This prevents rare occurrences from distorting baseline forecasts. Additionally, Forthcast employs unconstrained demand forecasting, which adjusts historical data to account for lost sales during stockouts. This prevents a "negative bias loop" where limited past sales lead to underestimated future demand.
"Bias isn't just an error - it's a systematic tendency to lean one way or the other." - Ben Van Delm, Horizon Solutions
Forthcast's self-assessing accuracy engine evaluates both bias (the direction of error) and accuracy (the size of the error). This dual evaluation provides a clear picture of model performance, ensuring reliable data to guide inventory decisions. These advanced methods not only refine forecasts but also deliver measurable improvements in inventory management.
Real Benefits for E-Commerce Businesses
Addressing forecast bias can lead to dramatic improvements. Studies in the consumer goods sector show that eliminating bias can reduce inventory levels by 20% to 30% while maintaining strong product availability. For Shopify merchants, this means unlocking working capital and cutting storage costs.
Forthcast’s 12-month demand projections support strategic planning, while smart reorder suggestions and low stock alerts help avoid both stockouts and overordering. The platform also tackles common forecasting challenges by breaking down bundles into individual SKU forecasts and using mature product data to inform projections for new launches. These features significantly reduce the manual effort and bias often tied to traditional forecasting methods.
Conclusion
Understanding the difference between bias and accuracy is essential for making better forecasting decisions. Accuracy measures the size of your errors, helping you manage safety stock and holding costs. Bias, on the other hand, shows whether your forecasts consistently lean toward overestimating or underestimating demand, which can lead to stockouts or excess inventory. As RELEX Solutions puts it, "Effective accuracy measurement reveals where forecast errors actually hurt the business and where they have minimal impact".
This level of insight doesn't just improve day-to-day operations - it can have a noticeable impact on your business. Studies in the consumer goods industry indicate that addressing forecast bias can cut inventory levels by 20% to 30% while still maintaining high product availability. The result? Freed-up working capital and happier customers.
AI-driven forecasting tools take these concepts and turn them into real-world solutions. By removing human bias and identifying patterns that traditional methods often overlook, machine learning boosts accuracy by an additional 2–5 percentage points. These gains lead directly to smarter ordering decisions and stronger financial performance.
For Shopify merchants, Forthcast delivers these advanced capabilities through features like its hybrid baseline model, signal tracking, and unconstrained demand forecasting. By analyzing bias and accuracy at the SKU level, Forthcast ensures you can trust your forecasts and make informed inventory choices. With a 14-day free trial and pricing starting at just $19.99/month, it offers e-commerce businesses access to enterprise-level forecasting without breaking the bank.
FAQs
How can businesses identify and reduce bias in their demand forecasts?
To tackle bias in demand forecasts, businesses should begin by measuring forecast bias - an indicator of whether forecasts habitually overestimate or underestimate demand. Metrics like mean forecast error are especially helpful for spotting systematic patterns.
Here’s how to address and reduce bias effectively:
- Examine past errors: Dive into historical data to identify trends or repeating mistakes in forecasts.
- Refine forecasting models: Make adjustments to models to correct for any identified biases.
- Blend statistical tools with expert insights: Combine data-driven models with human expertise for a more balanced and reliable forecast.
Consistently reviewing and improving forecasting methods can lead to more precise predictions, ultimately supporting better inventory management and operational efficiency.
What causes bias in demand forecasting?
Bias in demand forecasting often stems from human influences like subconscious habits, workplace pressures, or goal-driven incentives that shape predictions. For instance, forecasters might unintentionally inflate or downplay demand figures to align with expectations or fulfill specific objectives, which can result in consistent errors.
Additional factors include misreading historical data, overlooking external elements like market shifts or seasonal changes, and psychological traits such as overconfidence or discomfort with uncertainty. Tackling these challenges is essential for producing more accurate and dependable forecasts.
How does forecast bias affect inventory and business performance?
Forecast bias can greatly influence both inventory management and a company's financial health. When demand forecasts consistently overshoot, businesses may find themselves stuck with surplus inventory. This not only drives up storage costs but also ties up valuable capital and increases the risk of products becoming obsolete. On the flip side, underestimating demand can lead to stockouts, lost sales, and unhappy customers.
Beyond these immediate issues, bias erodes the dependability of demand planning, complicating decisions around purchasing, production, and distribution. Tackling forecast bias is crucial to improving accuracy, which in turn helps maintain optimal inventory levels, cut costs, and enhance profitability. Balancing bias and accuracy plays a critical role in ensuring a more efficient supply chain and stronger financial results.
Forecast demand and avoid stockouts — Forthcast for Shopify.
Related reading: Forecast Bias vs Accuracy in Demand Planning
About the Author

Hylke Reitsma is co-founder of Forthsuite and a supply chain specialist with 8+ years of hands-on experience at Shell, Verisure, and Stryker. He holds an MSc in Supply Chain Management from the University of Groningen and writes practical guides to help e-commerce teams run leaner, faster supply chains. Selected by Replit as 1 of 20 founders for the inaugural Race to Revenue Cohort #1 (2026) and certified as a Replit Platform Builder.
LinkedIn